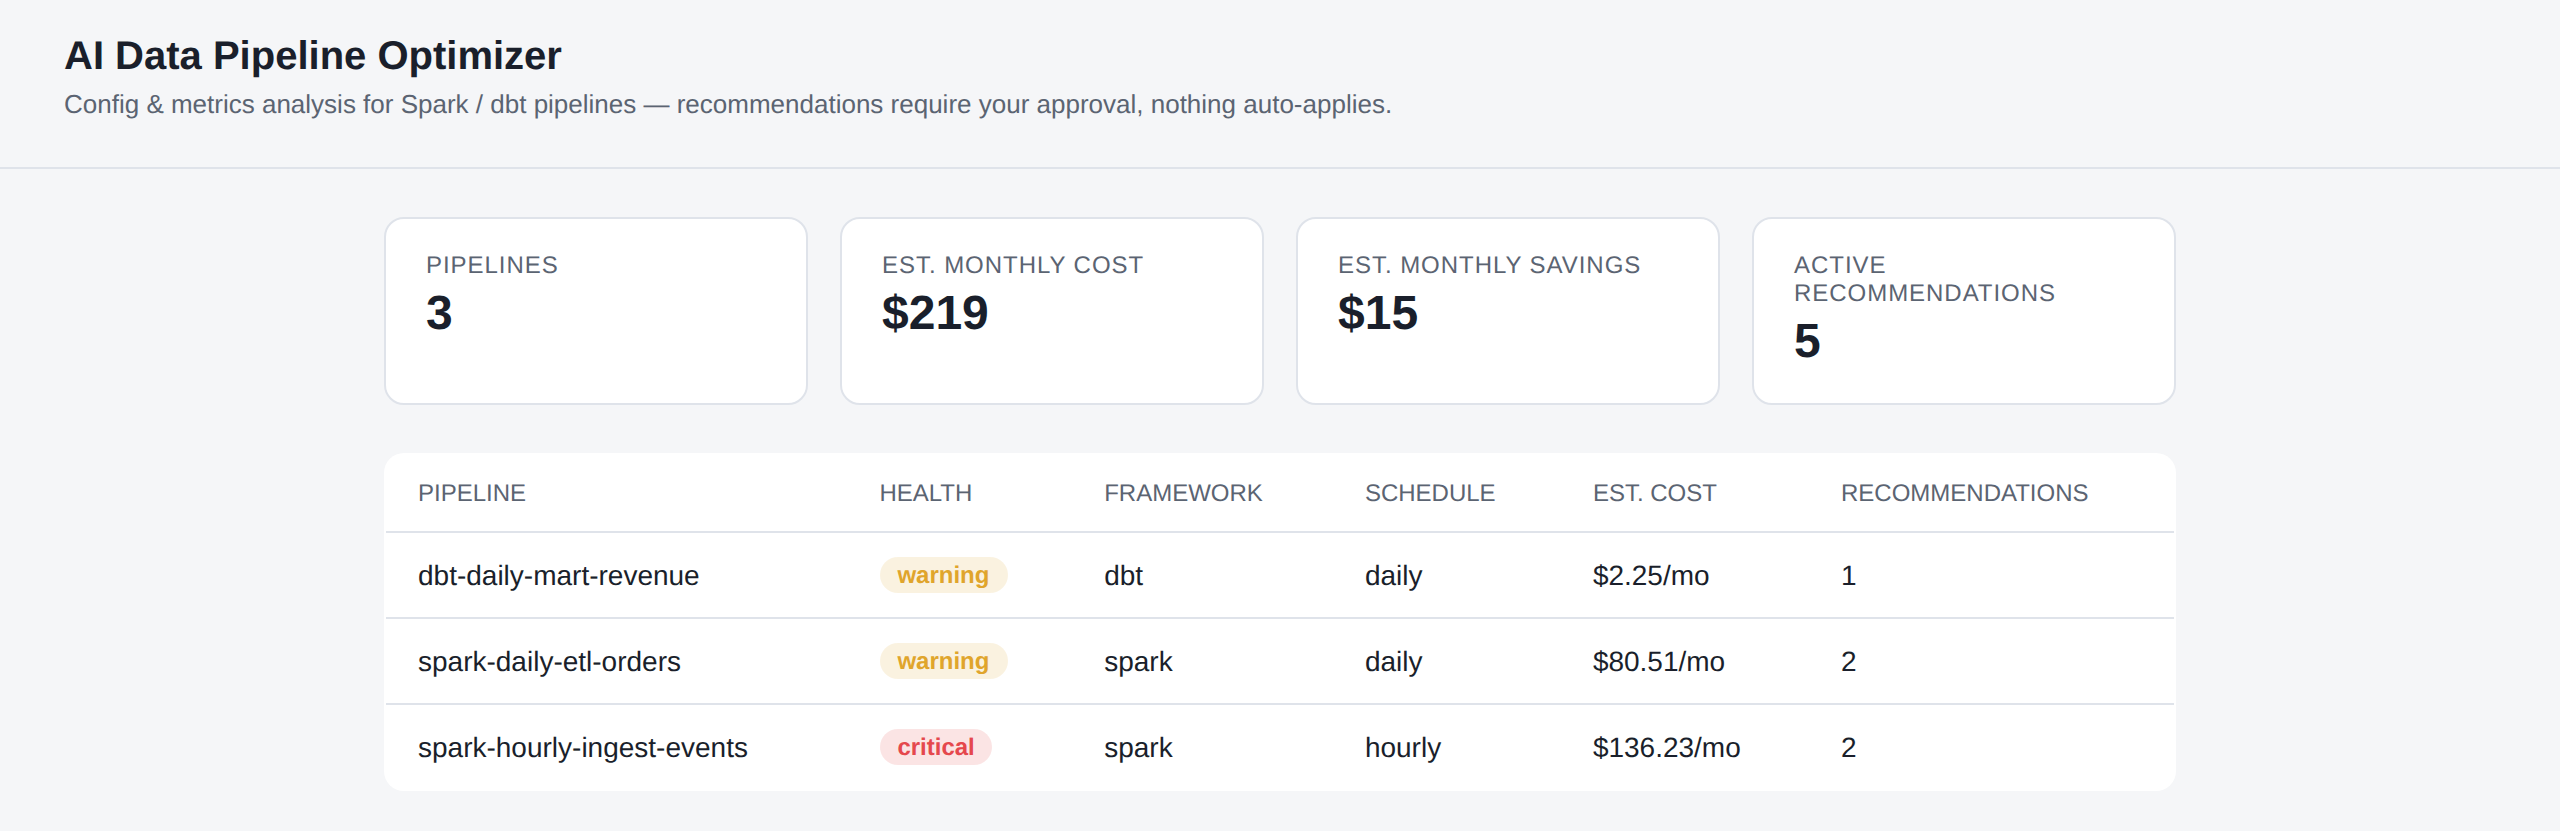
opti-pipe watches your pipeline runs, compares them against your configs, and tells you exactly what's wasting money or risking a failure — with a diff you can read and a number you can trust. Nothing ships without your click.
Not ready to try it today? Get notified when this reaches production.
Data engineers waste hours guessing at executor memory, batch sizes, and cluster size — and get it wrong in both directions.
Over-provisioned clusters and executor memory sit idle, burning budget on capacity nobody is using — and nobody notices until the bill arrives.
Under-provisioned memory and unoptimized parallelism cause OOM kills and queue delay — usually discovered in production, at the worst time.
opti-pipe reads config files alongside execution telemetry — no need to eyeball dashboards across four different tools.
Stage/job completion time and queue delay, tracked per run to catch bottlenecks before they compound.
Processing rate derived per run, so scaling issues show up before a pipeline falls behind its SLA.
Executor heap usage, allocated vs. actual CPU, and GC pause time — the signals that separate "wasteful" from "about to OOM."
Instance type, cluster size, and schedule combine into a monthly cost estimate — and a savings number for every fix.
How it works
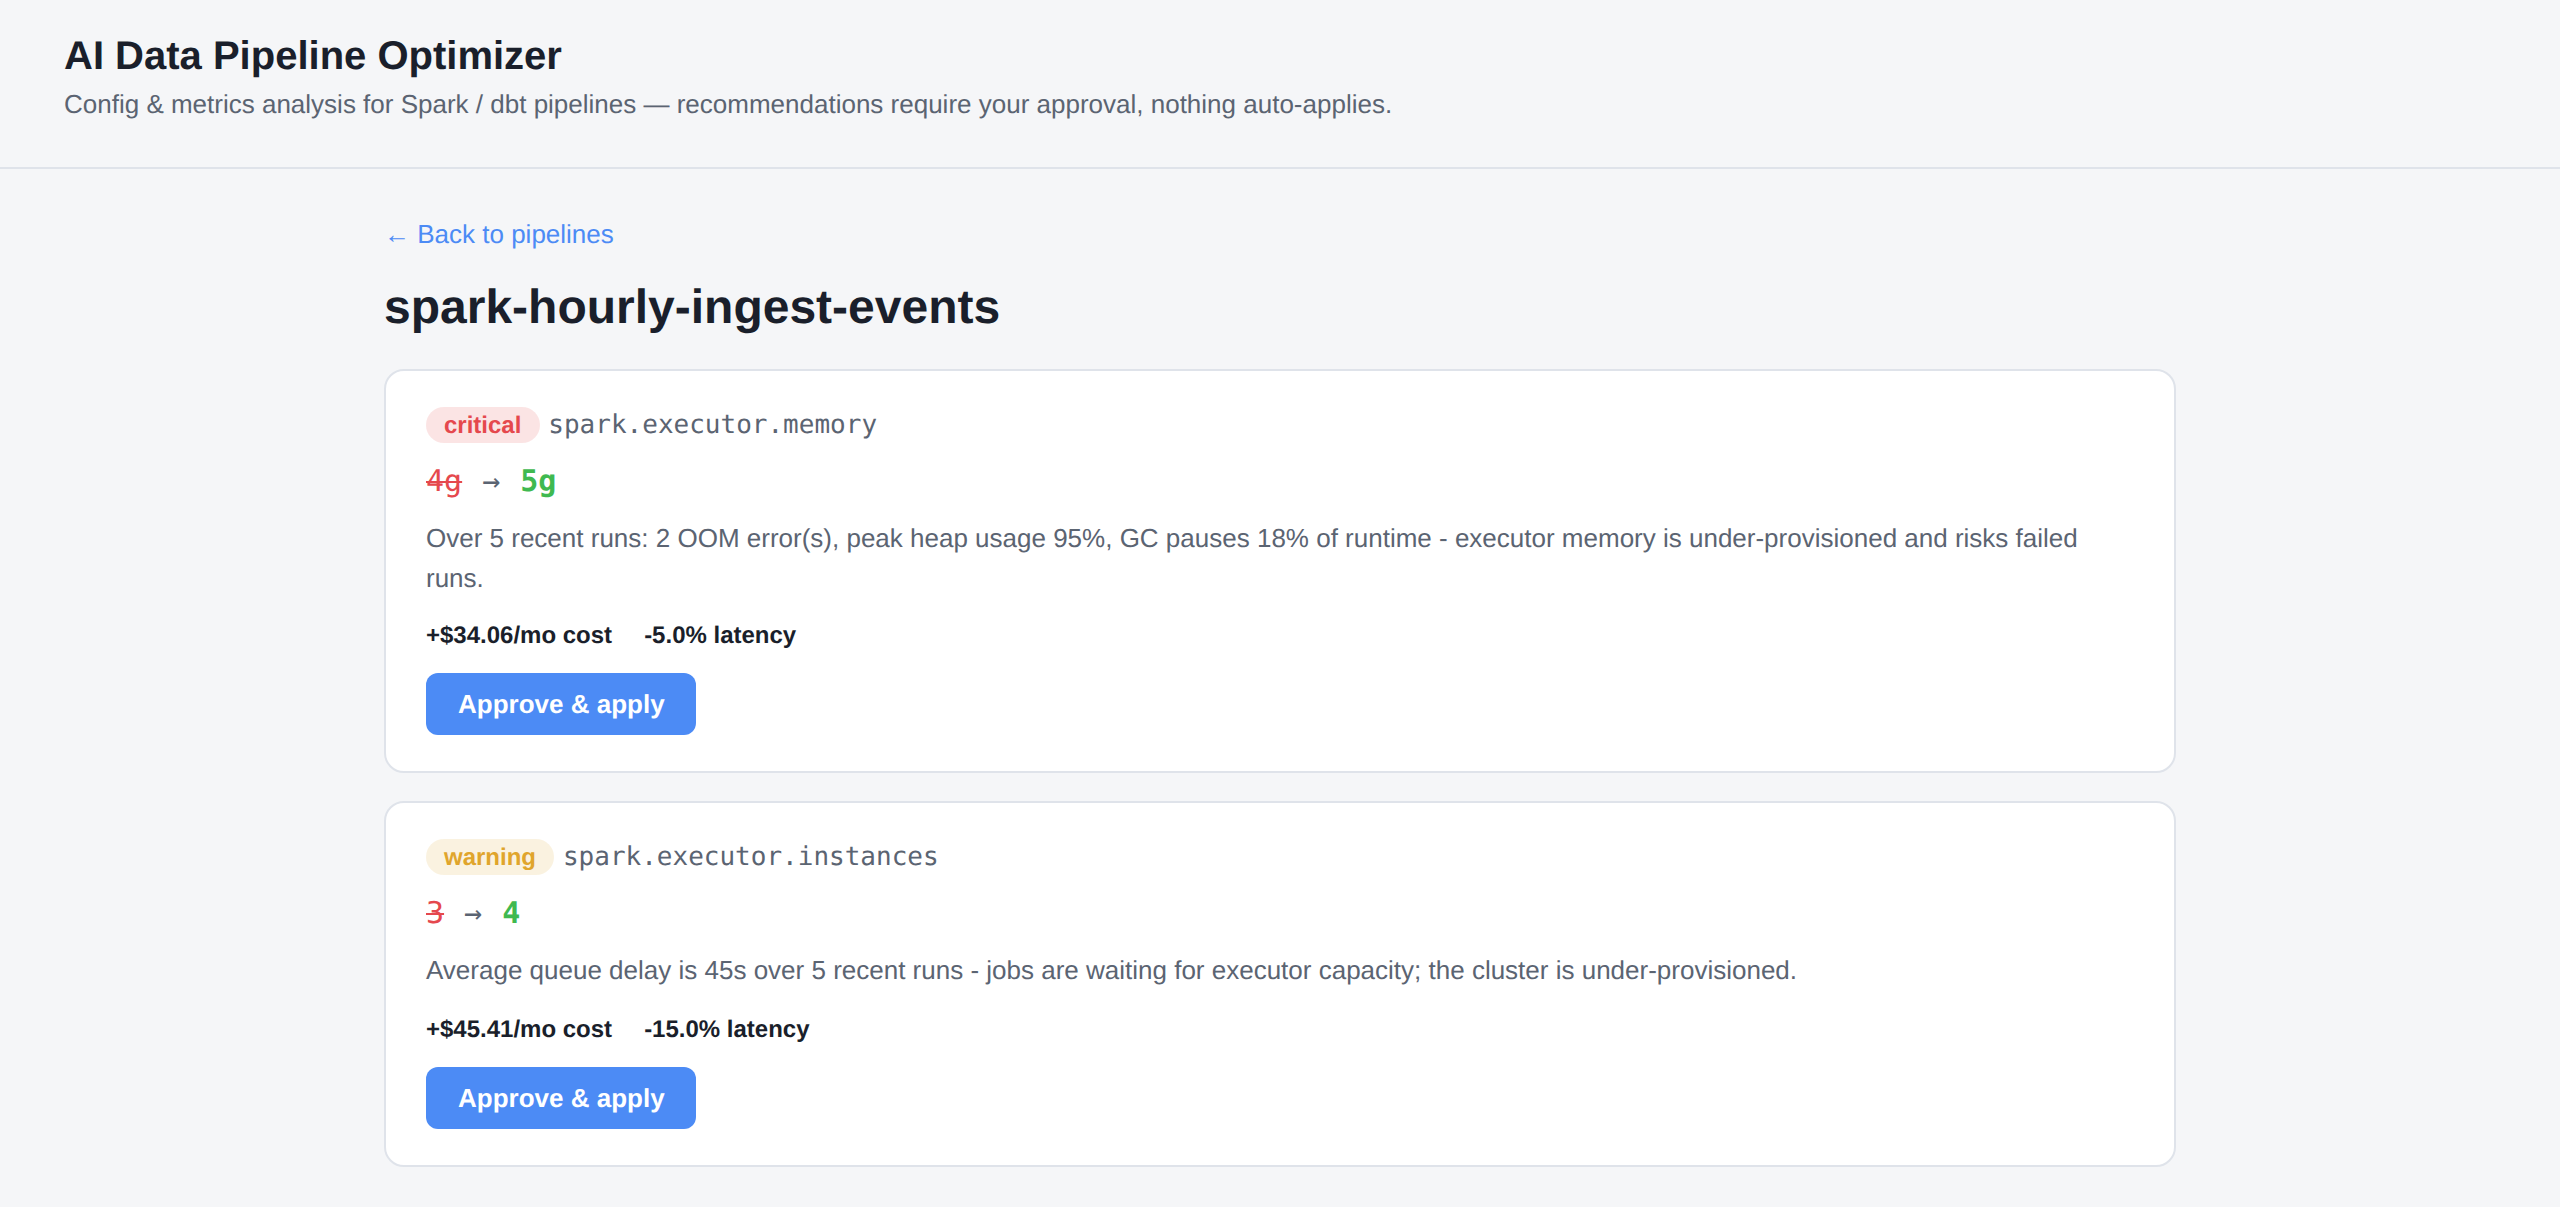
I don't trust an agent to touch a production Spark config unattended, so it doesn't. You approve every change in the dashboard below, or nothing happens.

# seven deterministic rules, no model in between
Rule 02 is the one I actually needed. Some Spark job would randomly OOM, I'd lose an
evening staring at heap and GC numbers trying to work out what changed, and eventually I got tired of
doing it by hand and wrote this instead. If it's useful to you too, good — if not, tell me why, that's
worth more to me than a compliment.
— I'm the only person who works on this
No auto-apply. Some optimization tools have an "autopilot" mode that
applies changes to your cluster after every run. I didn't build one — there's
no switch to turn it on. GET /recommendations recomputes live from
the current config and metrics on every call, so there's no hidden state that
could drift from what you last approved.
The seven rules above stay free, deterministic, and fully unit-tested — that doesn't change. On top of them, an optional "Ask AI" button sends your metrics and the rules' own output to a real Claude model for a plain-English critique: the same natural-language second-opinion idea larger platforms charge enterprise pricing for, here as one button with your own API key.
A few sentences on this pipeline's overall health, written from its actual run metrics.
Does the deterministic engine's recommendation actually look right given the numbers? The model is explicitly asked to disagree if it should.
Trends across runs, outliers, correlations between metrics — patterns no fixed threshold rule is built to catch.
This part costs real money per click, so I made it optional instead of automatic. Each click is a billed Claude API call, using your own Anthropic API key (a claude.ai subscription doesn't cover API access). Nothing else on this page needs one, and everything else works the same whether or not it's configured.
One FastAPI process. No Docker, no message queue, no external service to configure before you can see it work.
Saying "no auto-apply" is the easy part to be honest about. Here's what's actually still missing, so you can check it against your own pipeline before you rely on this for anything.
dbt does — it reads an actual run_results.json from your own
dbt run. Spark metrics are still hand-typed sample data; there's no
Spark REST API or event-log reader yet. What that would take, and why Flink's next →
Memory sizing, shuffle partitions, instance count, dbt thread count (both by duration and by model-count-per-thread). Nothing here catches data skew, partition pruning, file sizing, or retry storms — that needs more rules, not a different architecture, and I haven't written them yet.
A pipeline you add and any run data you upload live in memory only — no database, nothing written to disk — and disappear the moment the server restarts. Click "Ask AI" and that pipeline's metrics go to Anthropic's API for that one request, nowhere else.
Everyone using the same link sees the same in-memory state right now. Fine for one person trying it out; not built yet for multiple teams using it at once.
Explore the live sample data, or add your own dbt pipeline and see real recommendations.